Ronaldo vs Messi
team
Leon Bork
duration
4 weeks
responsibilities
Concept, Design,
Coding

overwiev
This data visualisation explores the question of who is the best player of all time and compares the two players in various aspects of the game.
dataset
There are 1413 entries in the dataset, and each entry is a goal - that's every goal Ronaldo and Messi have scored on club soil up to March 2023.
Visualisation
points
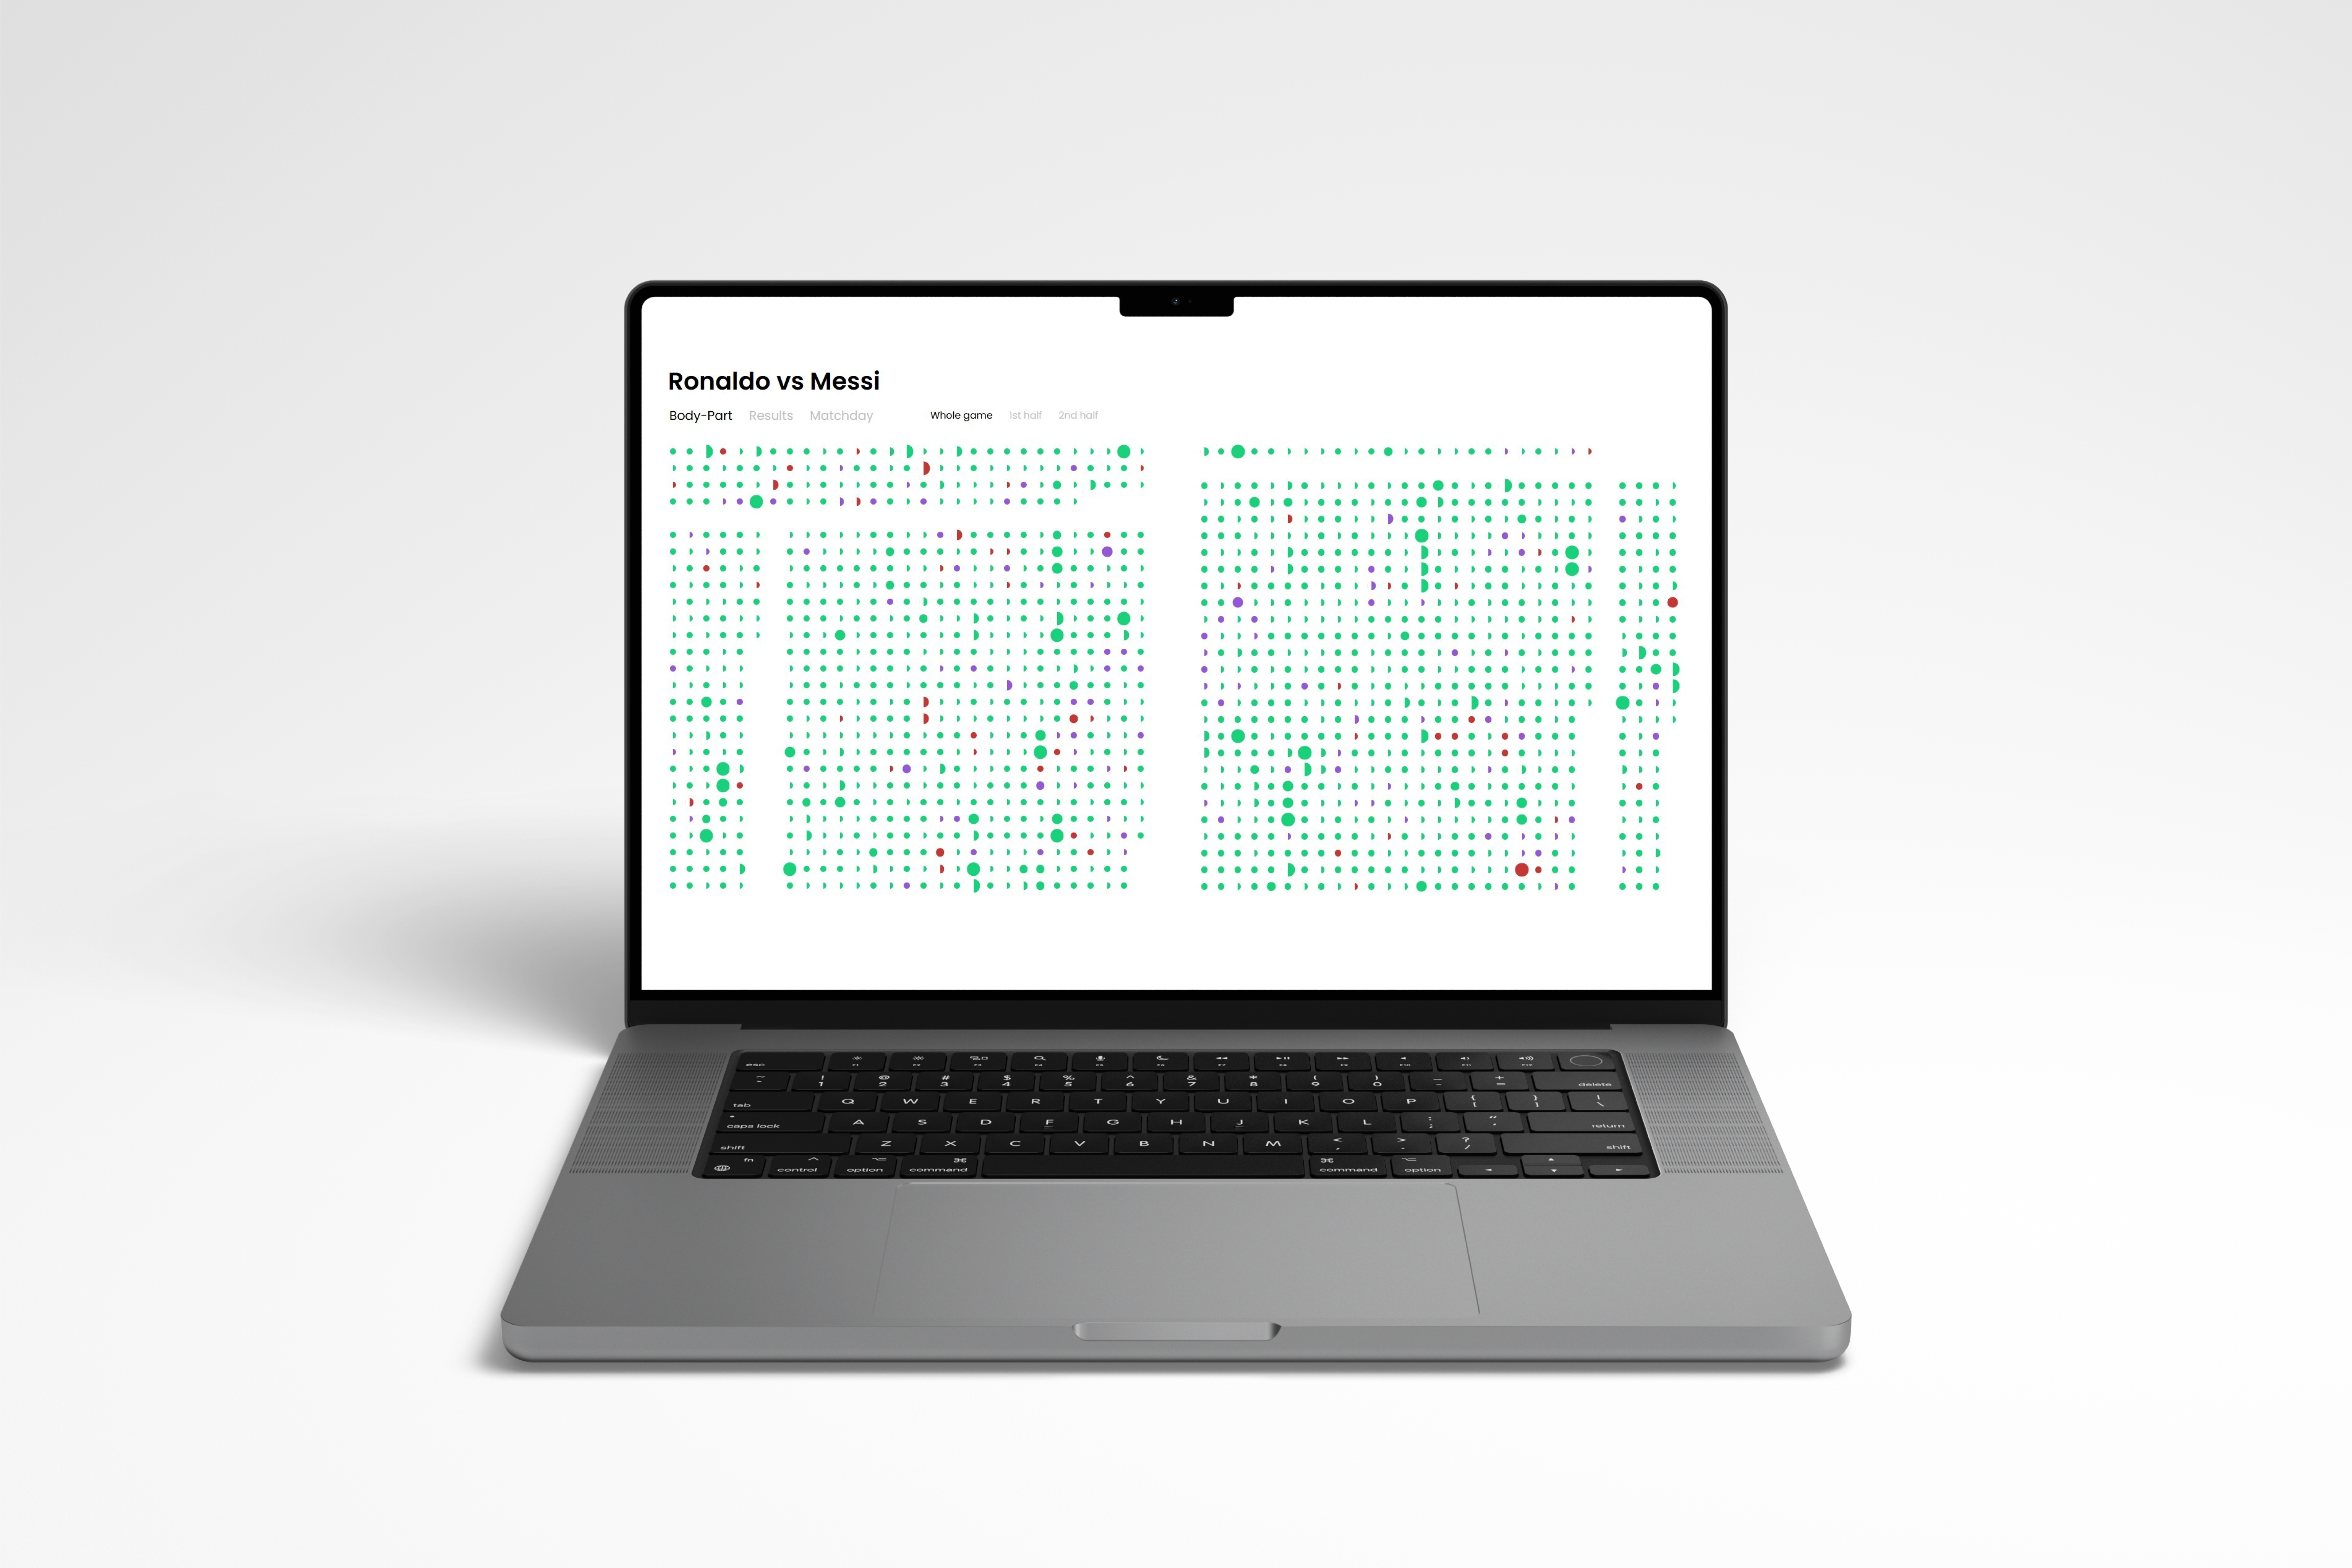
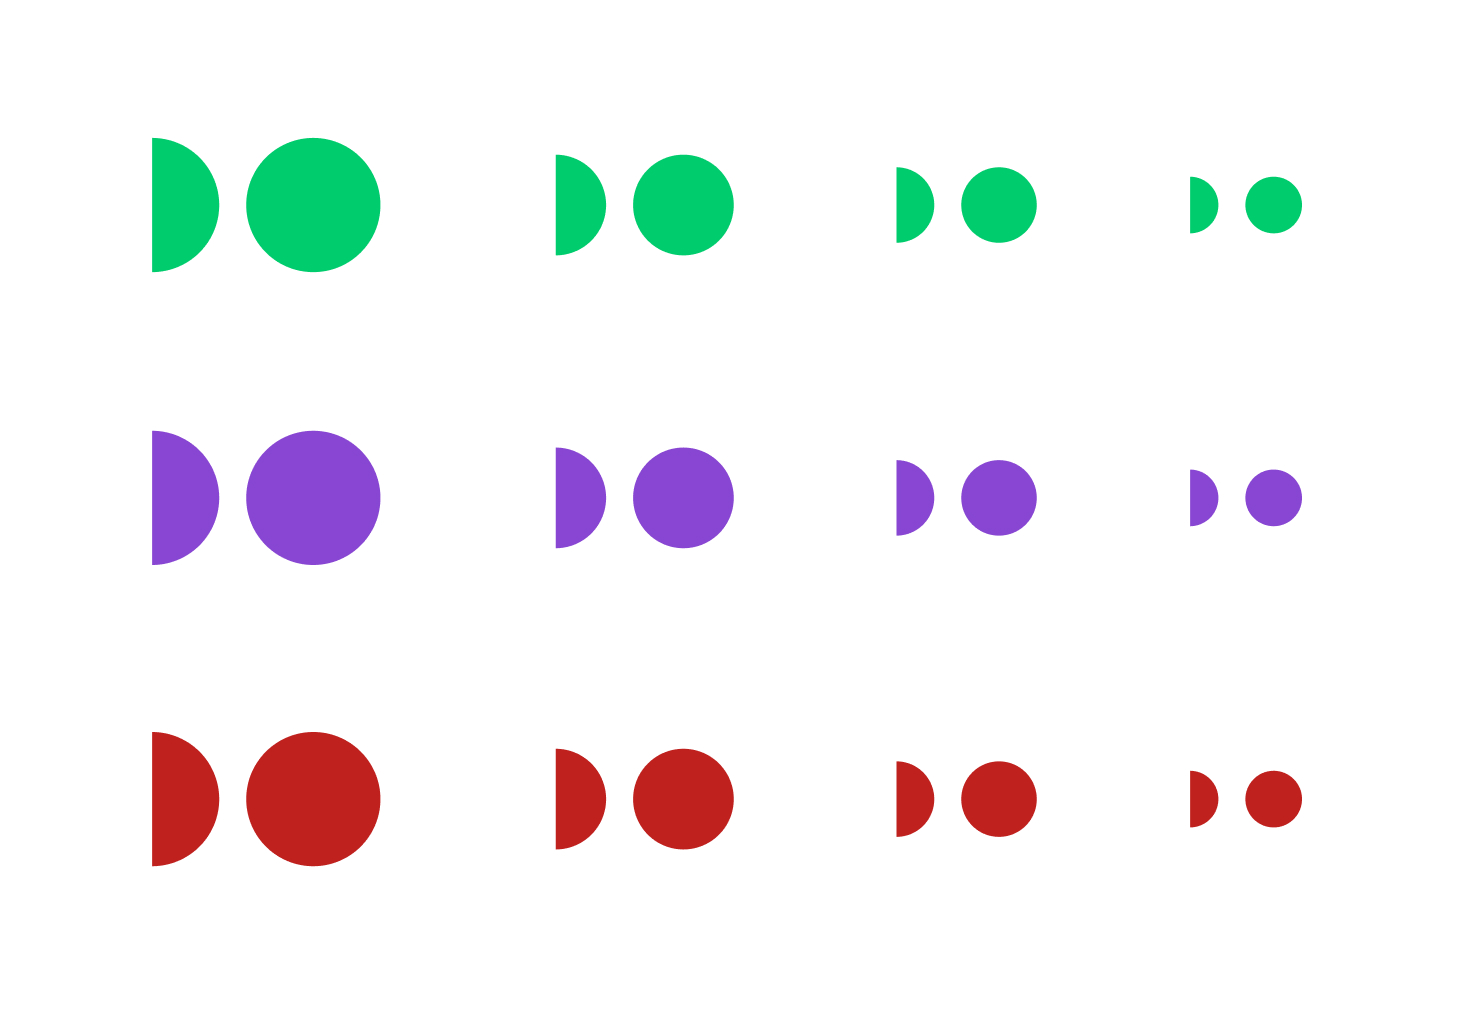
Each goal scored is visualized by a point, the points have 3 different colors: green if the game in which the goal was scored was won, purple if there was a draw and red if the game was lost. There are also 4 different point sizes: the larger the point, the more important the game in which the goal was scored was, for example the largest point stands for finals or the smallest for a normal league game or a game in the group stage of the Champions League.

position
The data visualization consists of two halves: On the left side you can see Ronaldo's goals, on the right side you can see Messi's goals. In the body part's view, the goals are divided into 3 groups, with the headers at the top, the goals scored with the left foot below the headers on the left and the goals scored with the right foot on the right. In the Results view, the goals are sorted according to the match result, in the Matchday view according to the importance of the matches.
Interactions
navigation & filter
Using the navigation you can switch between the different views as described, to the right of this there are filter options, there is the 'whole game' filter, with which you can see all goals, there is the 'first half' filter, with which you can filter out all goals that were not scored in the first half and the 'second half' filter, with which you can filter out goals that were not scored in the second half.
hover & click
On hover the dots get bigger, when you click on them a label appears with information about the goal like the name of the scorer, the season, the matchday and the opponent